Comprehensive Analysis of the Digital Advertising Landscape in the United States

Digital advertising involves promoting products or services through online channels to enhance brand visibility, drive traffic, and generate leads or sales using data-driven strategies.
The industry incorporates various formats such as digital video, search engine advertising, social media, banner ads, digital audio, classifieds, connected TV, in-app ads, and influencer advertising.
Market Projections and Key Figures
- Projected Ad Spending: The digital advertising market in the US is expected to reach US$298.4 billion in 2024.
- Largest Segment: Search Advertising is projected to lead with a market volume of US$132.0 billion in 2024.
- Global Context: The US will account for the largest share of global ad spending, contributing US$298 billion in 2024.
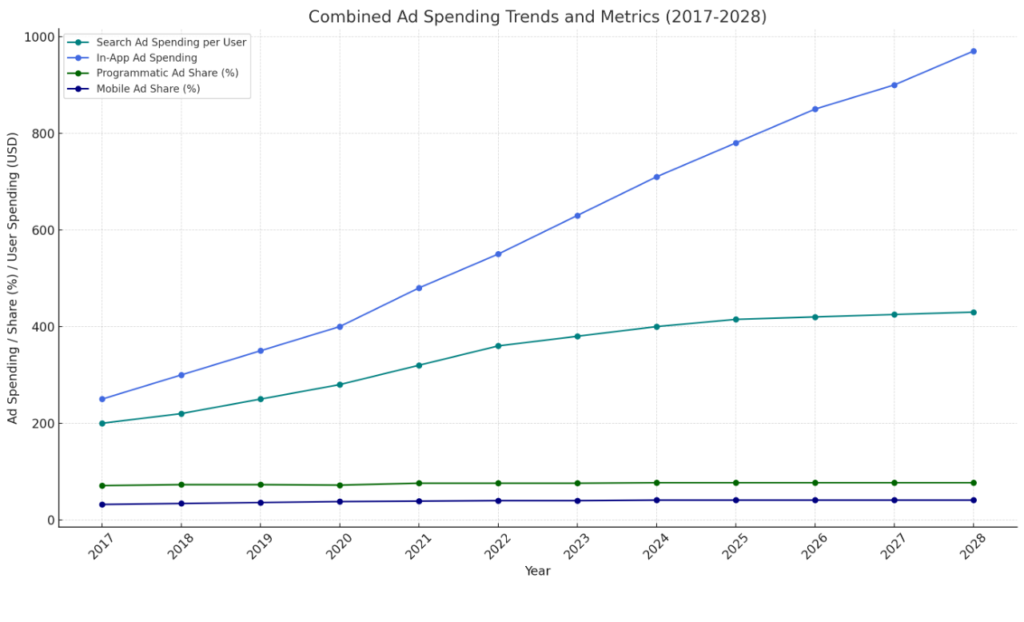
- Average Ad Spending per User: In the Search Advertising segment, ad spending per user is forecasted to be US$416.9 in 2024.
- Mobile Dominance: By 2028, mobile advertising is anticipated to constitute 73% of the total ad spending.
- Programmatic Growth: 82% of digital advertising revenue is projected to come from programmatic advertising by 2028.
Market Structure and Key Components
The US digital advertising market comprises the following sub-segments:
- Audio Advertising
- Banner Advertising
- Classifieds
- Influencer Advertising
- In-App Advertising
- Search Advertising
- Social Media Advertising
- Video Advertising
Ad Spending Trends and Growth Patterns

Ad spending growth across different digital advertising channels has shown variable patterns:
- Search Advertising continues to lead and show consistent growth.
- Influencer Advertising peaked significantly around 2018 but has since stabilized.
- Video Advertising shows a steady upward trend in ad spending.

- Visual representation showing fluctuations across segments such as influencer, video, and search advertising.
Desktop vs. Mobile Ad Spending
The shift towards mobile has been significant, with projections showing a dominant mobile ad spending share over the years.

- Depicts the gradual decline in desktop ad spending and the rise in mobile advertising share from 2017 to 2028.

Programmatic vs. Non-Programmatic Ad Spending
Programmatic advertising continues to dominate the market, with projections indicating a steady increase in its share.

- Shows the increase in programmatic advertising from 71% in 2017 to 82% by 2028.
In-App Advertising Growth
In-app advertising spending in the US has been on the rise, driven by the proliferation of mobile apps and increased screen time. digital advertising landscape in Bangladesh

- Illustrates the consistent growth trajectory of in-app advertising, from US$200 billion in 2023 to projections surpassing US$275 billion by 2028.
Average Ad Spending per Internet User
Average spending per user across various advertising channels highlights the importance of targeted approaches:
- Search Advertising leads with projected average spending per user of US$416.9 in 2024.
- Social Media Advertising and In-App Advertising follow closely.

- Comparison of average ad spending per user across formats such as search, social media, and in-app advertising.
Ad Spending by Industry
The retail and technology sectors are major contributors to digital ad spending in the US.

- Depicts the leading sectors, with retail accounting for 22% and technology for 19%.
Future Outlook
The US digital advertising market is set for continued growth, spurred by advancements in technology, increased internet penetration, and a strong shift towards mobile and programmatic advertising.
Brands aiming for success should focus on multi-channel approaches that emphasize mobile and programmatic ad strategies.
